Overview
Selling short puts on AAPL, GOOG, and NVDA with similar expiries revealed a practical difference:
NVDA’s buying power (BP) requirement tends to move intraday, while AAPL and GOOG remain comparatively stable.
This article explains why—contrasting Reg‑T with risk‑based (portfolio) margin, walking through a worked example,
and showing how BP reacts to implied volatility (IV).
1) Margin Models
1.1 Reg‑T (rule‑based) for a Short Put
For a short put, a common Reg‑T requirement per contract (100 shares) is:
Margin = max( 0.20*S − OTM + P,  0.10*S + P,  $2.50 ) × 100
where:
  S = underlying price
  K = strike
  P = current option premium
  OTM (for puts) = max(S − K, 0)
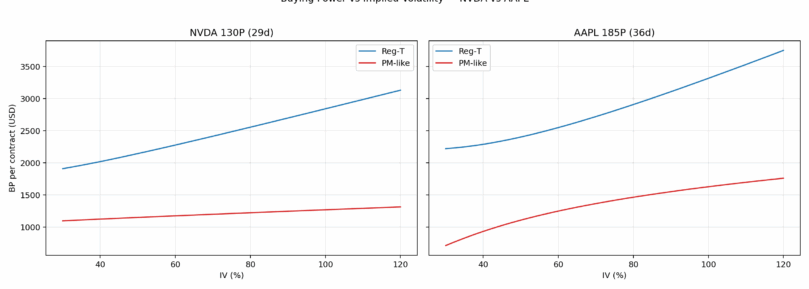
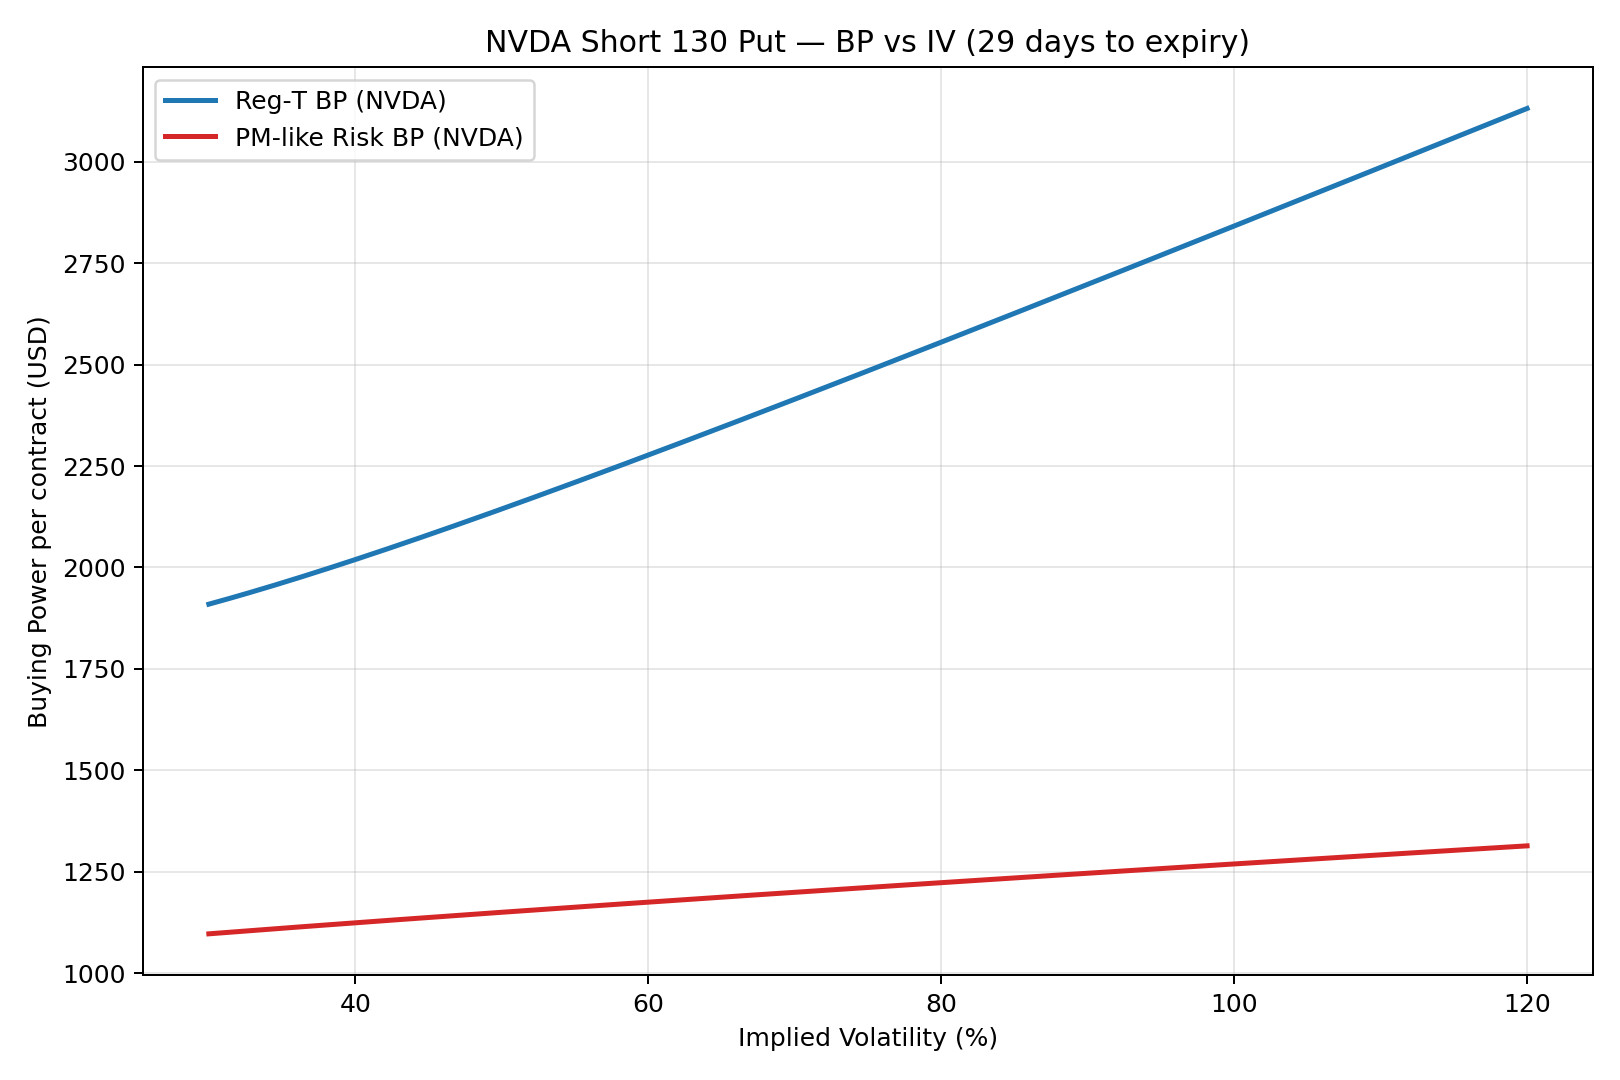
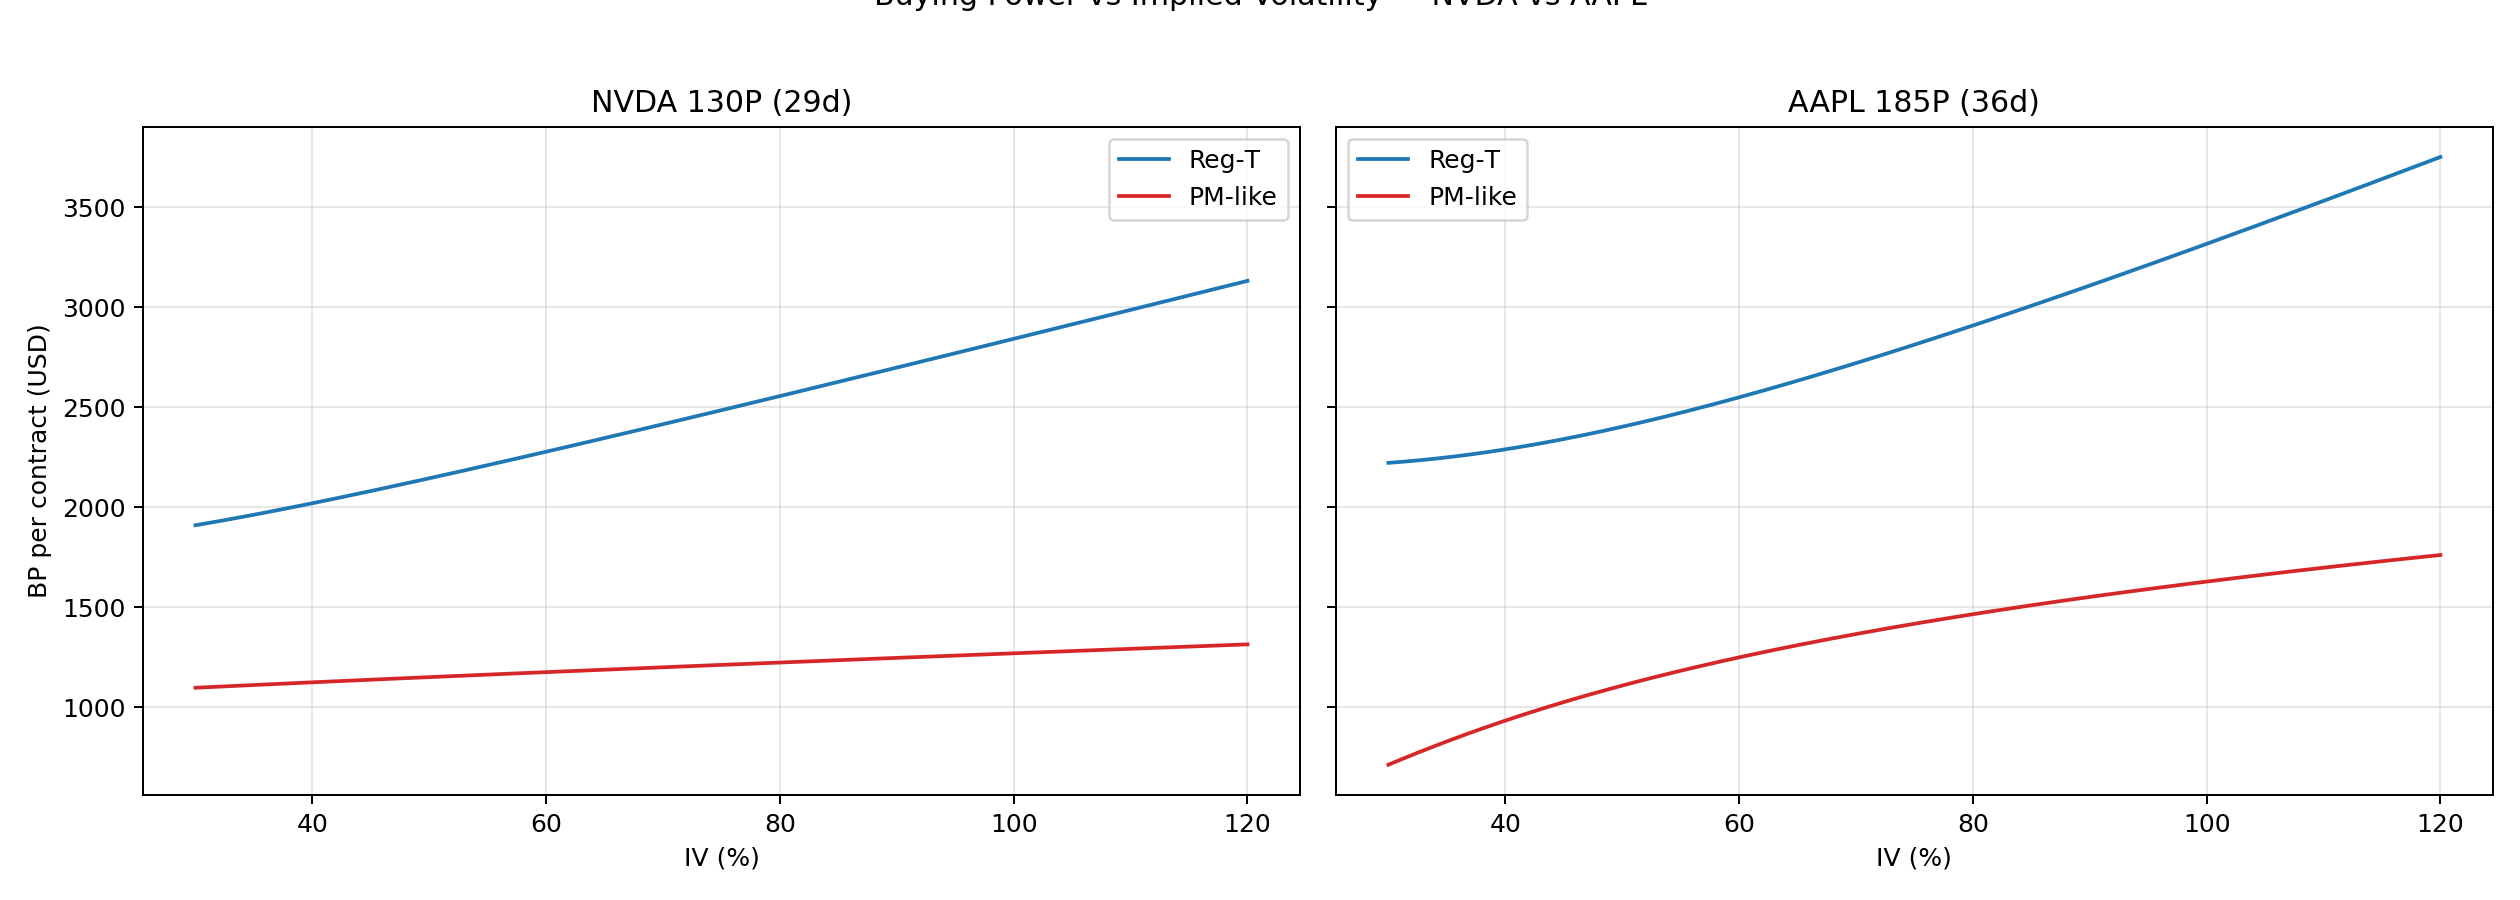
Only the premium P is directly IV‑sensitive, so Reg‑T BP usually moves modestly with IV.
1.2 Portfolio / Risk‑Based (TIMS/SPAN‑style)
Risk engines compute worst‑case loss under spot/volatility shocks. A simple representation is:
Risk BP ≈ 100 × ( max over scenarios [ p(S', σ') ]  −  p(S, σ) )

S' = stressed spot (e.g., −15% down or +10% up)
σ' = stressed IV (e.g., ×1.25 on the down move, ×0.90 on the up move)
p(·) = option price under the given inputs
This approach is highly sensitive to IV (vega) and curvature (gamma), which is why NVDA’s BP tends to “wiggle” intraday.
2) Worked Example
Assumptions: NVDA S=140, K=130, 29 DTE; AAPL S=220, K=185, 36 DTE; annual rate r=5%.
Reg‑T uses the formula above; the risk‑based example stresses price by −15% / +10%, and volatility by ×1.25 / ×0.90 respectively.
2.1 Reg‑T
NVDA 130P
OTM = S − K = 10
Case A = 0.20*S − OTM + P = 28 − 10 + P = 18 + P
Case B = 0.10*S + P = 14 + P
Case C = 2.50
Reg‑T BP ≈ max(18 + P, 14 + P, 2.50) × 100
If P ≈ 0.62 ⇒ Reg‑T BP ≈ $1,862 per contract
AAPL 185P
OTM = 220 − 185 = 35
Case A = 0.20*S − OTM + P = 44 − 35 + P = 9 + P
Case B = 0.10*S + P = 22 + P
Case C = 2.50
Reg‑T BP ≈ max(9 + P, 22 + P, 2.50) × 100
If P ≈ 0.46 ⇒ Reg‑T BP ≈ $2,246 per contract
2.2 PM‑like Risk
Repricing with Black–Scholes under the shocks above (illustrative):
| IV (decimal) | Current Put ($) | PM‑like BP ($/contract) |
|---|---|---|
| 0.40 | 2.19 | 1,124 |
| 0.60 | 4.77 | 1,175 |
| 0.80 | 7.55 | 1,223 |
| 1.00 | 10.42 | 1,269 |
3) Visuals — Buying Power vs IV
4) Why NVDA Moves More
- Higher IV & Beta: BP sensitivity roughly scales with vega × change in IV.
- Gamma Risk: Delta shifts faster in NVDA options, so small spot moves change risk quickly.
- Stress Scenarios: A −15% shock pushes NVDA puts deep ITM; AAPL/GOOG remain closer to OTM under the same shock.
- Liquidity & Spreads: Conservative marking inflates worst‑case losses more in NVDA chains.
5) Practical Implications
- Expect BP swings in high‑IV names; maintain a cash buffer to avoid forced actions.
- Know your account type: Reg‑T vs Portfolio Margin. PM reacts more strongly to IV/gamma.
- Strike selection matters: deep OTM short puts often sit on the 0.10*S + P branch under Reg‑T, yielding steadier BP.
- Event risk (earnings, macro) can reprice IV abruptly, causing BP jumps.
- Mind liquidity: wider spreads and thinner size amplify model‑based cushions.
Bottom Line
NVDA’s intraday BP changes are driven by risk‑based margin reacting to higher IV and gamma. AAPL and GOOG, at the selected strikes
and maturities, sit in a calmer region of the risk surface—hence the stability you observe.